Reproducibility and Replicability in Geospatial Data Science
April 18, 2024
Outline
- What is reproducibility and replicability?
- Why do it?
- How do we do it?
- Questions
Learning objectives
- Understand what reproducibility and replicability are
- Know why they are useful
- Be aware of some of the tools that you can use
What is Reproducibility?
Ability for other people with a similar level of skill to reproduce your work.
Other people
- colleagues in company,
- group members in a project,
- yourself in a year when you want to use your project work for something else,
Fundamental part of research
Also is best practice - which will allow others to reproduce your work.
Why do it?
We need to have confidence that our research is good quality and we are doing good science
Peter Fisher, Uni of Leicteser UK (1993) compared seven different pieces of GIS software doing a viewshed analysis
and got seven (slightly) different results!

Why do it?
Fisher also discovered a major error in one piece of software which gave completely incorrect results.
Highlights the need for:
- Standards & testing to make sure this doesn’t happen
- Algorithms used to be published so people can see what is happening
- Issues when only binary files are available, and not the source code
Fisher, P. F. (1993). Algorithm and implementation uncertainty in viewshed analysis. International Journal of Geographical Information Systems, 7(4), 331–347. https://doi.org/10.1080/02693799308901965
Why do it?
Riggs & Dean, Colorado State (2007) did a similar investigation on viewshed analysis
Things have improved since 1993, but there are still differences in different software.
Riggs, P.D. and Dean, D.J. (2007), An Investigation into the Causes of Errors and Inconsistencies in Predicted Viewsheds. Transactions in GIS, 11: 175-196. https://doi.org/10.1111/j.1467-9671.2007.01040.x
Why do it?
- Standards & testing to make sure this doesn’t happen
- OGC
- But we probably do need more testing
- Algorithms used to be published so people can see what is happening
- Publish algorithms in journals
- Even more important with machine learning - transparency is important
- Issues when only binary files are available, and not the source code
- Growth in open source software - so you can see (and unpick) what is happening
What is Reproducibility & Replicability?
“[…] when the same analysis steps performed on the same dataset […] produce the same answer.” (Turing Way)

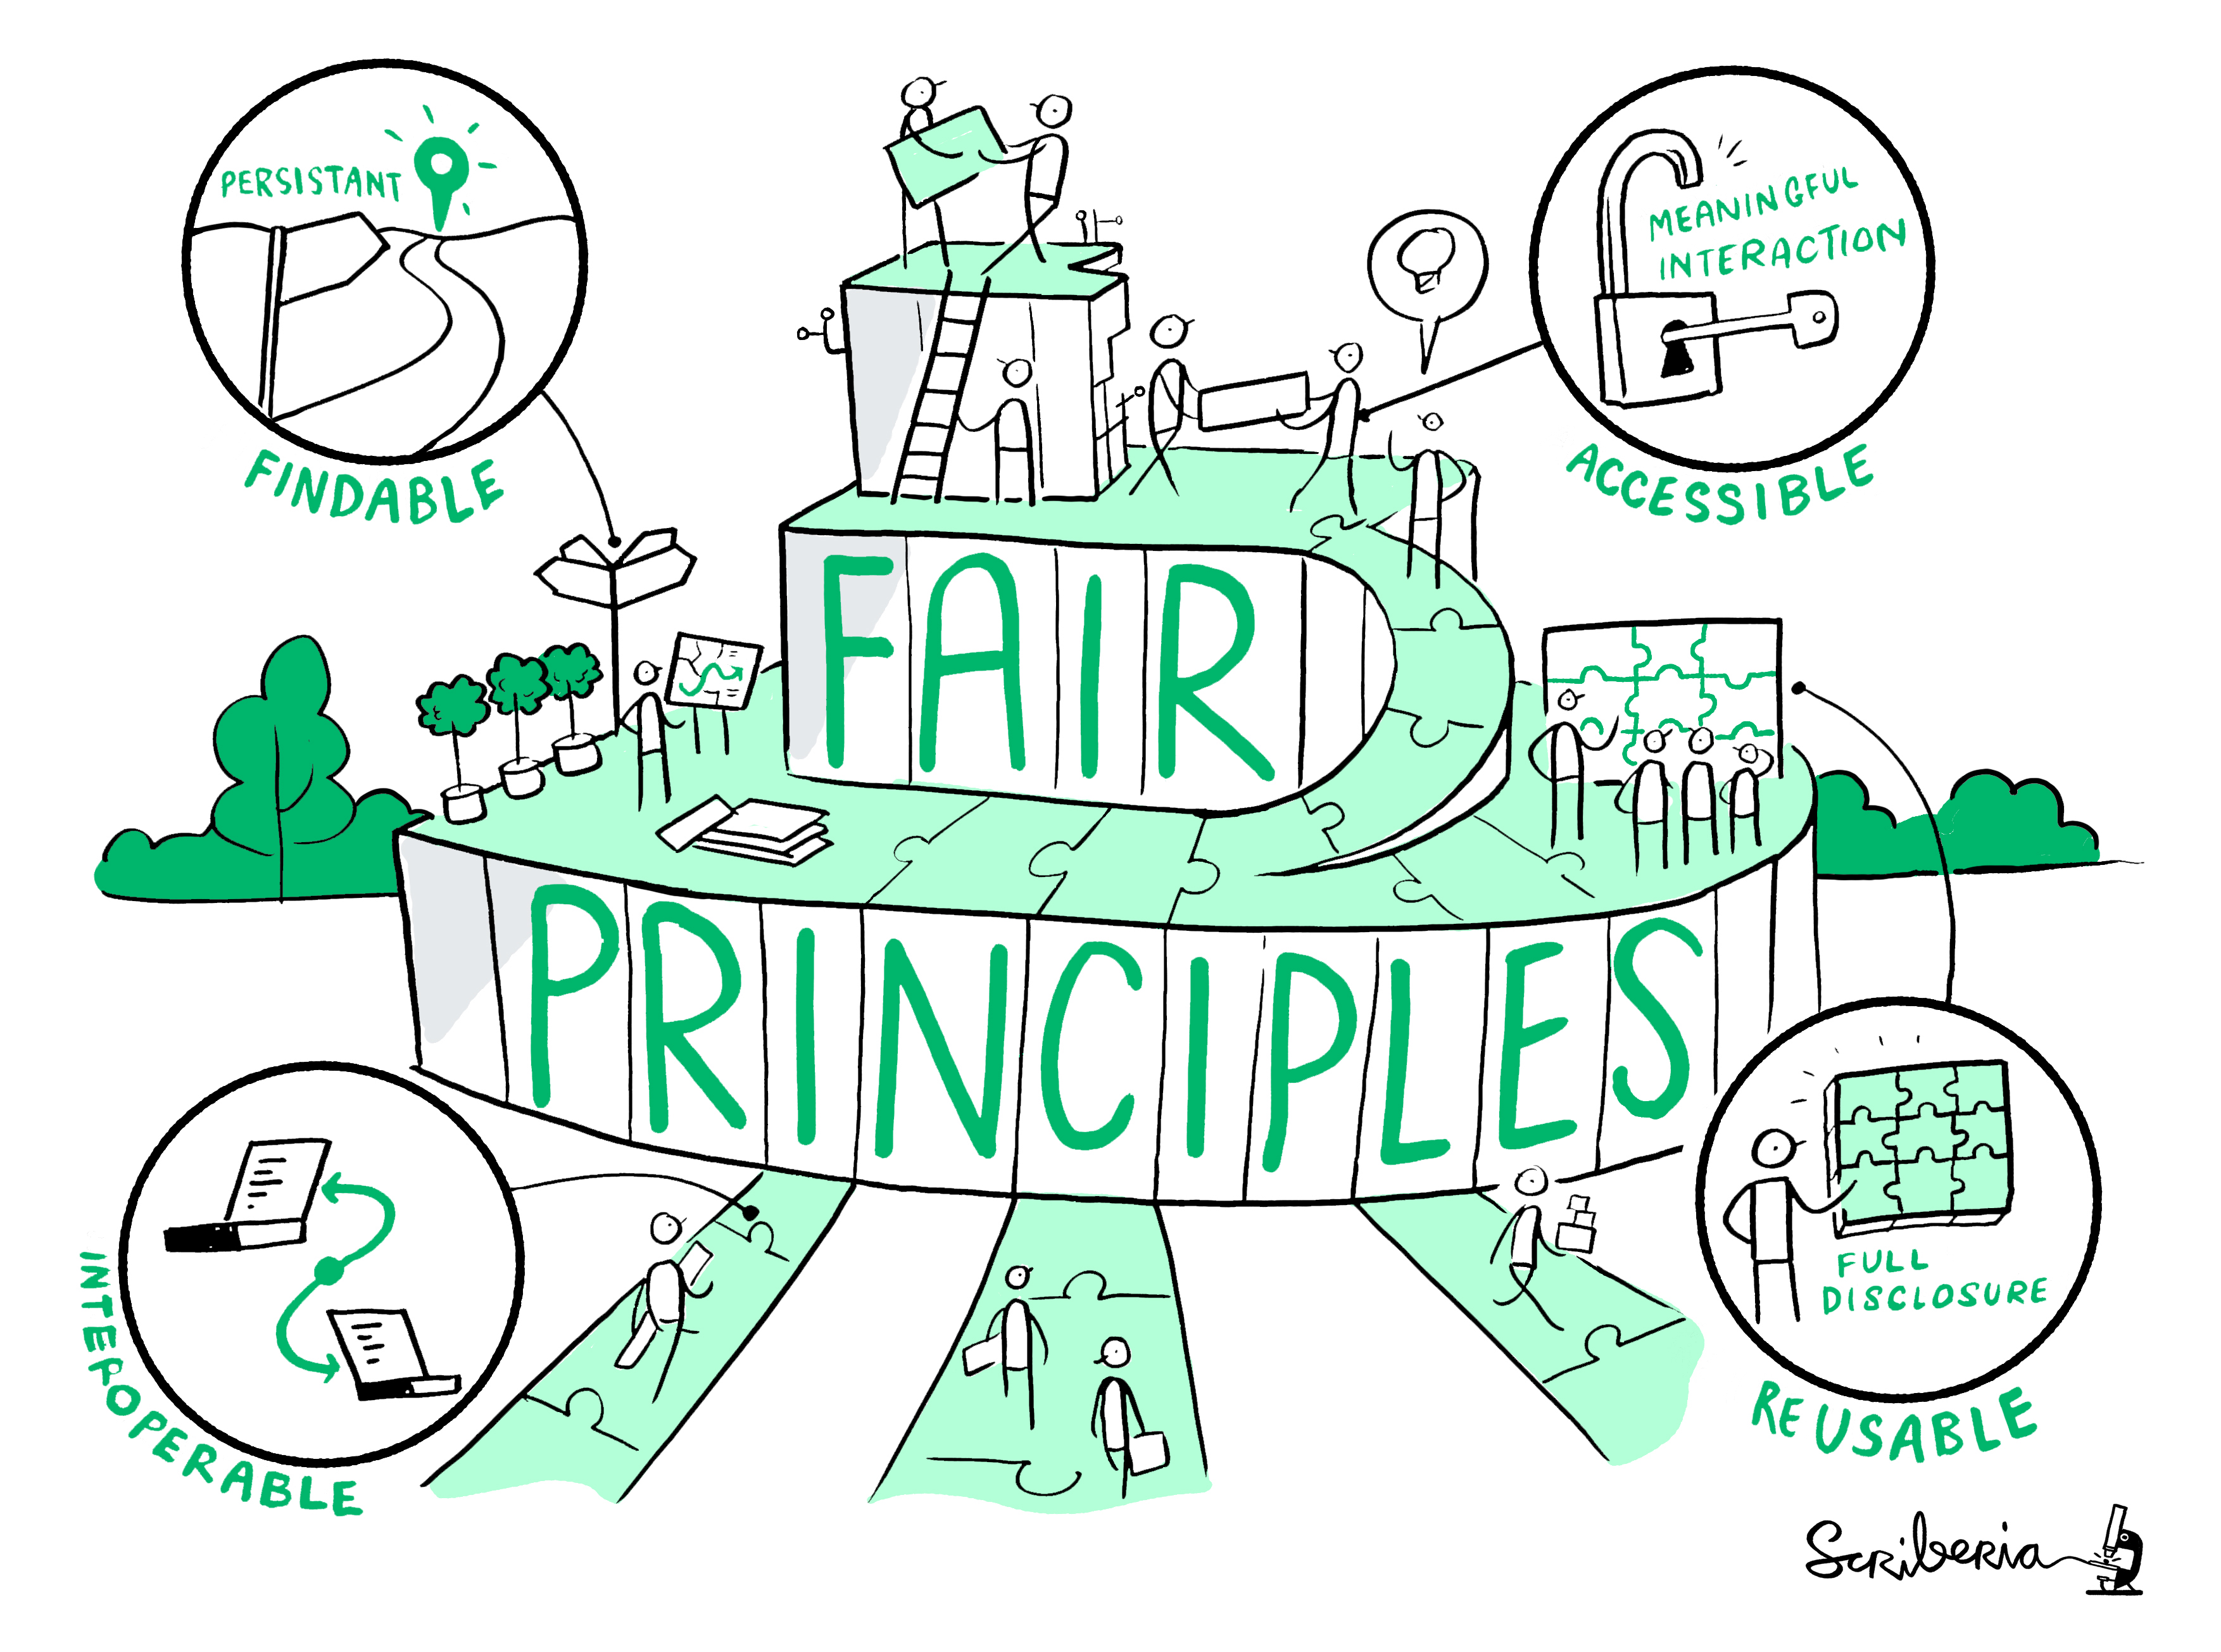
How do we make our research reproducible? - FAIR:
Findable
- Descriptive metadata and persistent identifier (DOI)
Accessible
- Code/data could be openly available OR access via authentication and if needed
Interoperable
- Data needs to be integrated with other data and interoperate with applications or workflows (Open formats)
Reusable
- Documentation and license (Open license - e.g. Creative Commons)
Research
Some journals & conferences ask you to submit code along with your paper
AGILE - https://reproducible-agile.github.io/
Anyone (with a similar level of skills) should be able to do reproduce your research and benefit from it.
One reason for open source tools.
If you do analysis in ArcGIS Pro, you need ArcGIS Pro to recreate that analysis.
If you don’t have ArcGIS Pro, what do you do?
It’s not just research
Other work can be useful if it can be reproducible:
quarterly or annual reports
repeating work over 200 areas, 50 business units, 365 days,
coming back to your work 6 months later - “please can you update this with this new data?”
How do we do this?
Documenting what you did is standard - Methods
If you can do what you did in a script, then you can also share this
ArcGIS Pro / QGIS
- graphical interface, click buttons, etc
R / Python
- write out the script
Setup - “environments”
To replicate a piece of work, you need to know what software they used
What version
What libraries / packages
What version of libraries or packages
Can record this in text
- “R 4.3.2, RStudio 2013.12.0, sf library 1.0-16” etc.
Or in code
- renv library https://rstudio.github.io/renv/articles/renv.html
Setup - Docker
Docker gives you a big box to put all this in
Then you say - I used this Docker environment
AGILE has a very nice overview
Version Control
If your project evolves over time, you may need to use version control
Provides a snapshot of your code at a specific point in time - I used this version of my code
Version Control (Git) allows you to do this, while still developing your code, and to see the differences (diff).
GitHub allows you to collaborate with other people on this.
Writing, Presentations
Also works for writing and presentations as well.
Markdown allows you to write plan text with tags - stars, hashes, etc.
Can also do analysis in this
LaTeX is a developved version of Markdown (or Markdown is a simple version of LaTeX)
RMarkdown allows you to run R code
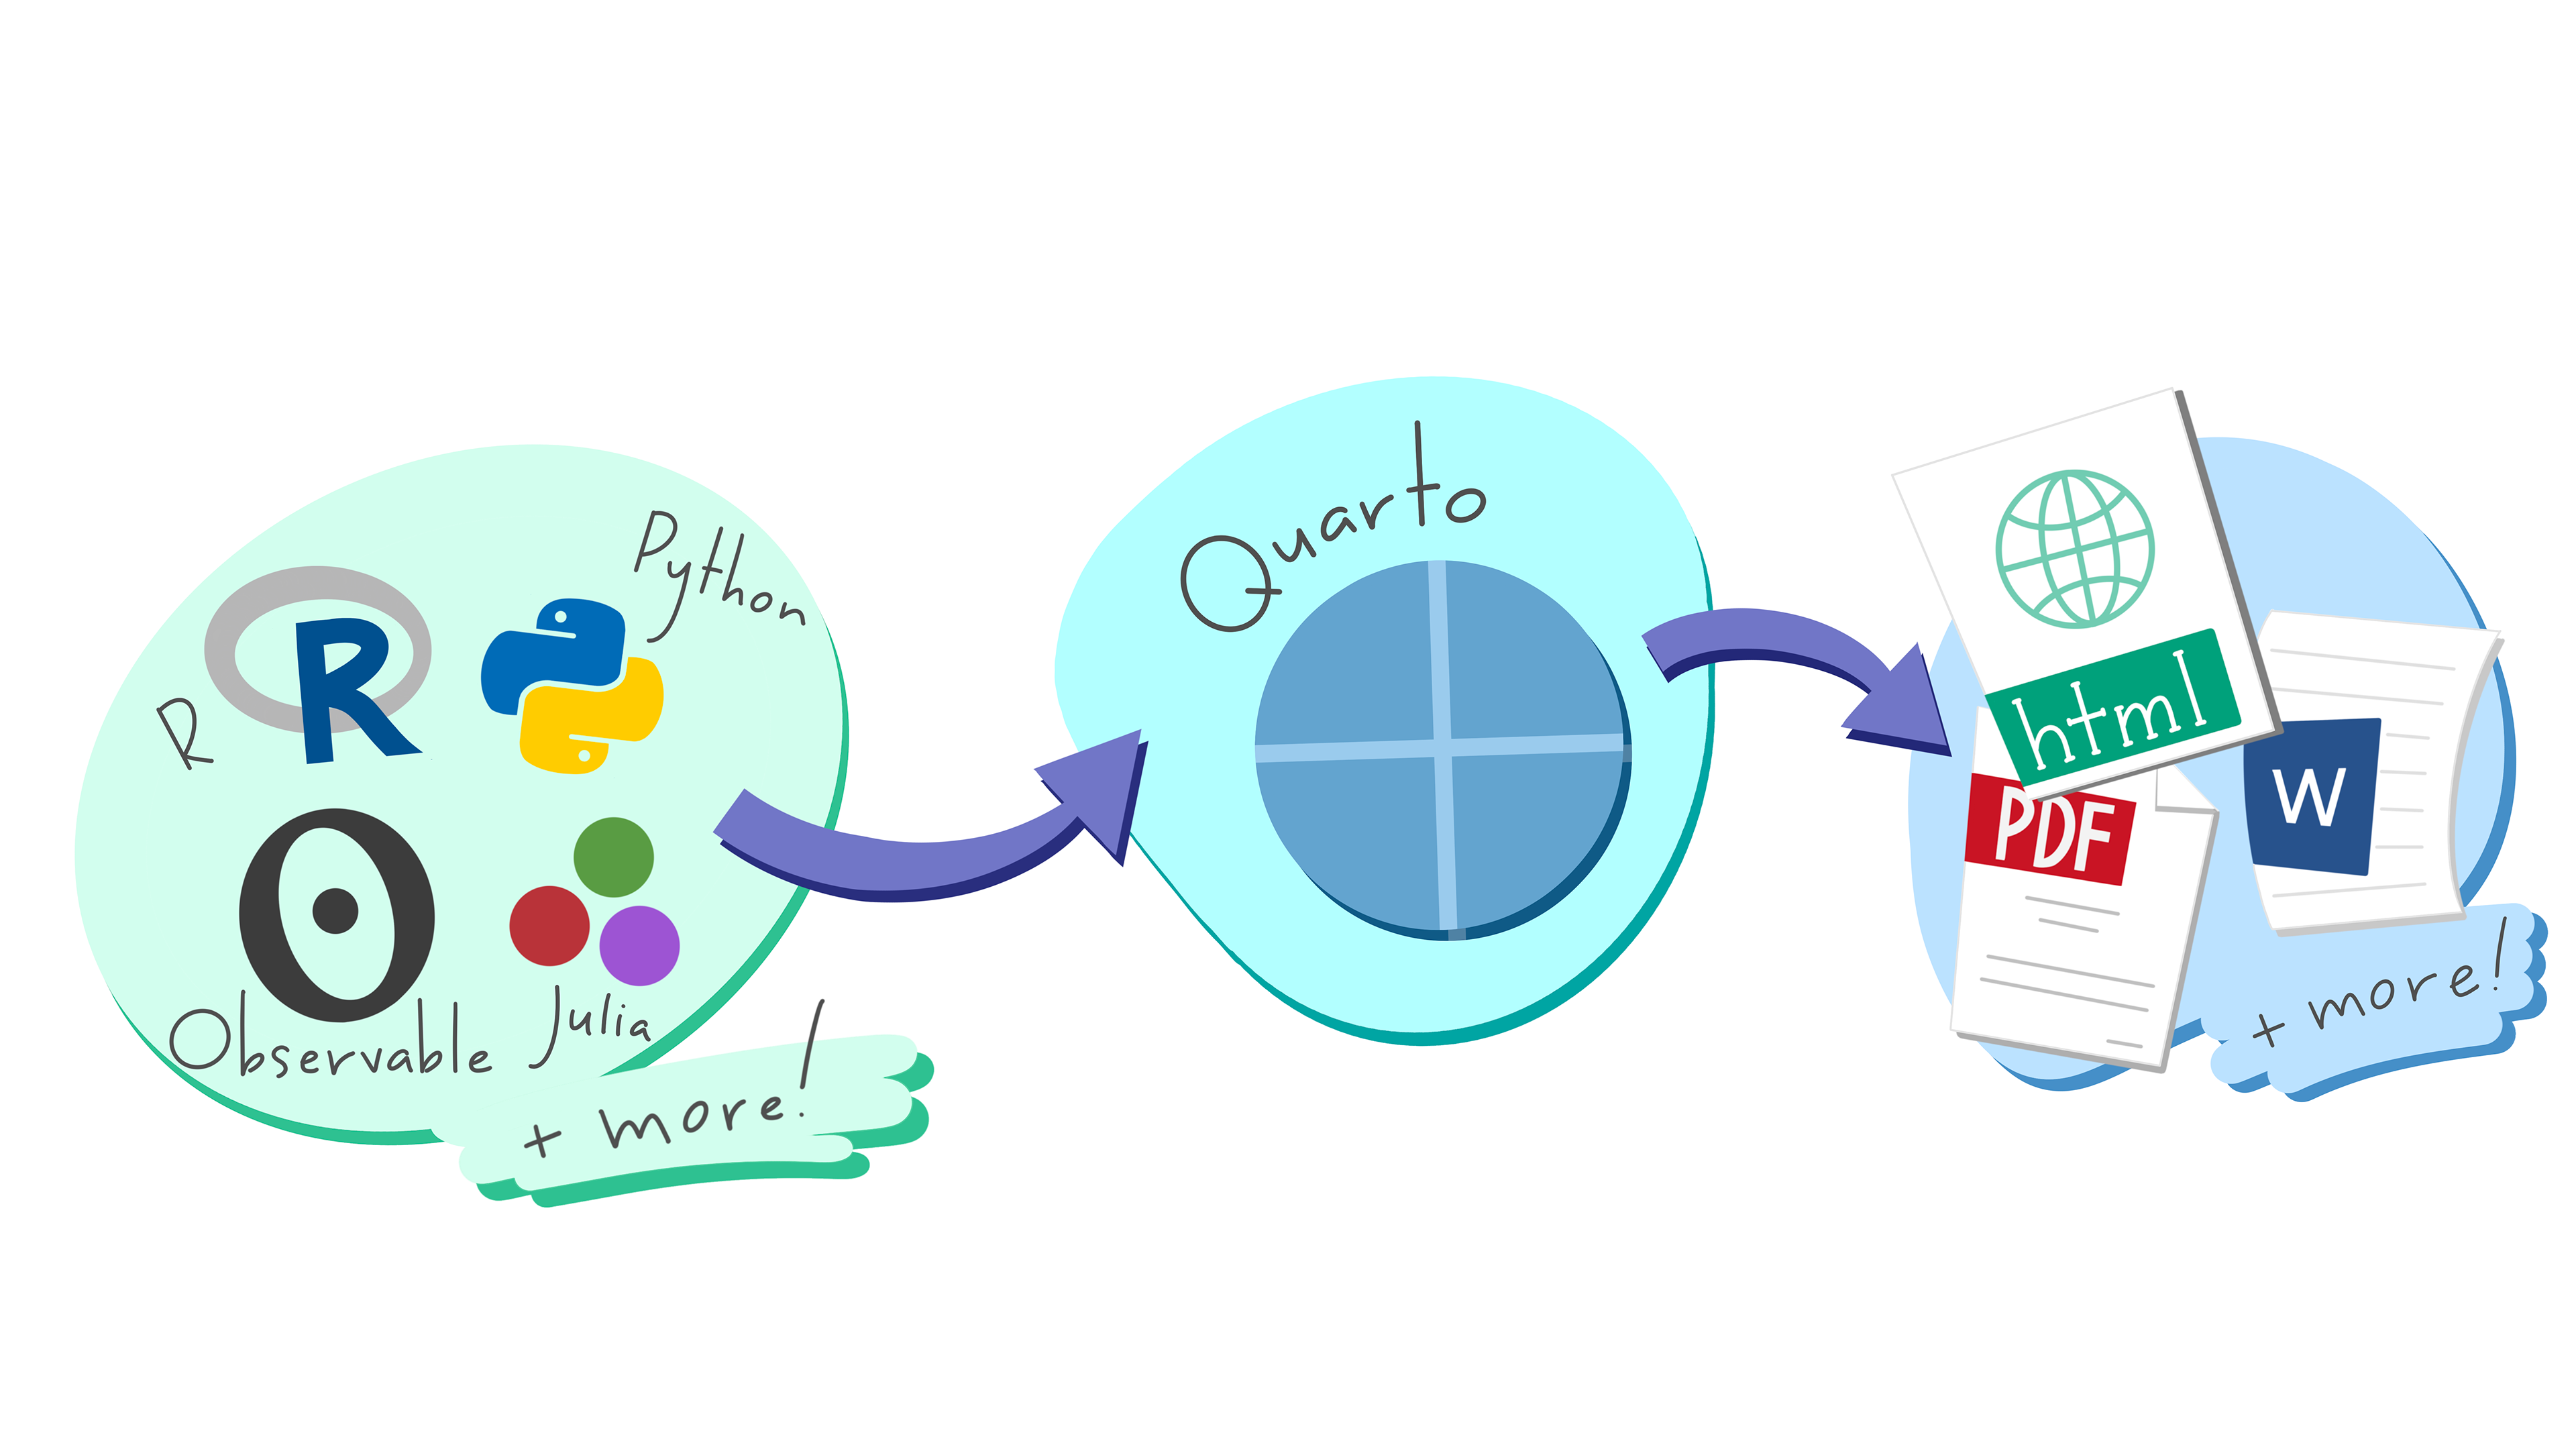
Quarto allows you to run other code (Python, R, etc.)
This presentation is written in Quarto.
Markdown example
| Syntax | Output |
|---|---|
*Italic* |
Italic |
**Bold** |
Bold |
~~strikethrough~~ |
|
[Link](url) |
Link |
i\hbar \frac{\partial \Psi}{\partial t} = -\frac{\hbar^2}{2m} \nabla^2 \Psi + V(\mathbf{r},t) \Psi |
\(i\hbar \frac{\partial \Psi}{\partial t} = -\frac{\hbar^2}{2m} \nabla^2 \Psi + V(\mathbf{r},t) \Psi\) |
Markdown example
- Markdown allows you to write plan text with tags - stars, hashes, etc.
Rendered Output

About Quarto
- Quarto is a new, open-source, scientific and technical publishing system
- Combine text and code to produce formatted documents
- Publish reproducible and dynamic presentations, dashboards, websites, blogs, and books in HTML, PDF, MS Word, etc.
- Multi-language support for R, Python, Julia, and more
- Quarto extends RMarkdown and shares similarities with Juypter Notebooks.

Formats
- Documents: HTML, PDF, MS Word, Open Office, ePub
- Presentations: Revealjs, PowerPoint,
- Wikis: MediaWiki, JiraWiki, …
- Many templates exist for academic documents: quarto-journals
- And much more: Jupyter, RTF, InDesign, …
How does Quarto work?

taken from What is Quarto - A Quick Intro FAQ
.qmd

.ipynb

Tools
Markdown text
| Syntax | Output |
|---|---|
*Italic* |
Italic |
**Bold** |
Bold |
~~strikethrough~~ |
|
[Link](url) |
Link |
i\hbar \frac{\partial \Psi}{\partial t} = -\frac{\hbar^2}{2m} \nabla^2 \Psi + V(\mathbf{r},t) \Psi |
\(i\hbar \frac{\partial \Psi}{\partial t} = -\frac{\hbar^2}{2m} \nabla^2 \Psi + V(\mathbf{r},t) \Psi\) |
Code chunks

Code chunks
```{r}
#| label: "iris-plot"
#| echo: TRUE
#| fig-format: svg
#| cache: TRUEs
data(iris)

plot(iris$Sepal.Length, iris$Sepal.Width,
     main = "Scatter Plot of Sepal Length vs Sepal Width",
     xlab = "Sepal Length (cm)",
     ylab = "Sepal Width (cm)",
     pch = 16, col = iris$Species)
```defaults to knitr engine (you can override the engine with engine: jupyter)
```{python}
#| label: fig-polar
#| fig-cap: "A line plot on a polar axis"

import numpy as np
import matplotlib.pyplot as plt

r = np.arange(0, 2, 0.01)
theta = 2 * np.pi * r
fig, ax = plt.subplots(
  subplot_kw = {'projection': 'polar'}
)
ax.plot(theta, r)
ax.set_rticks([0.5, 1, 1.5, 2])
ax.grid(True)
plt.show()
```
defaults to jupyter engine
You can use Python and R code together using the reticulate package
Quarto Showcase
Quarto Showcase
viewof bill_length_min = Inputs.range(
  [32, 50],
  {value: 35, step: 1, label: "Bill length (min):"}
)
viewof islands = Inputs.checkbox(
  ["Torgersen", "Biscoe", "Dream"],
  { value: ["Torgersen", "Biscoe"],
    label: "Islands:"
  }
)When to use Quarto?
Strengths & Weaknesses of Quarto for slides
Strengths 💪
- Consistency in Output
- Focus on content
- Support for (Explicit) Version Control (e.g. git)
- Great for Code (in Slides)
- Automation / Generated Contents
- Interactivity
Weaknesses 😢
- Harder to do fine layouting
- No WYSIWYG
- New Syntax to learn
- Software Maturity
Key Benefit: (Explicit) Version Control
- Going back through time
- Great for collaboration
- Allow sharing and adaptation
- Just like this presentation
- Allows automation
Practice what you preach!
By setting up your teaching materials in a reproducible manner, you demonstrate the value of reproducibility directly
- Useful for others
- Useful for future you when you teach this course again
Reproducible training materials are beneficial to us!
- I used some slides from a workshop I took part in on reproducible materials, which we developed:
Images: Scriberia with The Turing Way community (License: CC BY 4.0)
💻 Slides: Slides are publicly available at github.com/jansim/dra-reproducible-materials
📦 Software: Reproducible slides build with Quarto and deployed to GitHub Pages using GitHub Actions (details in the Quarto docs)
Source: Source code is available at github.com/jansim/dra-reproducible-materials
🖲️ DOI: (generated using GitHub + Zenodo, see GitHub docs)
License: Creative Commons Attribution 4.0 International (CC BY 4.0)
💬 Contact: We welcome any feedback via email or GitHub issues. Thank you!
Reproducible training materials are beneficial to us!
- We used the Reproducible and FAIR Teaching Materials slides from the Aug 2023 Train the Trainer programme
- Thank you very much to Esther Plomp and Lennart Wittkuhn 🙏 whose Quarto slides we used and developed!
Additional Resources
- The Turing Way handbook to reproducible, ethical and collaborative data science
- Richard McElreath (2020). Science as amateur software development. YouTube
- Quarto
- Quarto Documentation
- Quarto for Academics by Mine Çetinkaya-Rundel
- Version Control
- Version Control Book
- https://github.com/git-guides
Thank you! 🙏
Images: Scriberia with The Turing Way community (License: CC BY 4.0)
💻 Slides: Slides are publicly available at github.com/jansim/dra-reproducible-materials
📦 Software: Reproducible slides build with Quarto and deployed to GitHub Pages using GitHub Actions (details in the Quarto docs)
Source: Source code is available at Github.com/nickbearman/reproducibility-replicability-gds-penn
License: Creative Commons Attribution 4.0 International (CC BY 4.0)
💬 Contact: We welcome any feedback via email or GitHub issues. Thank you!


